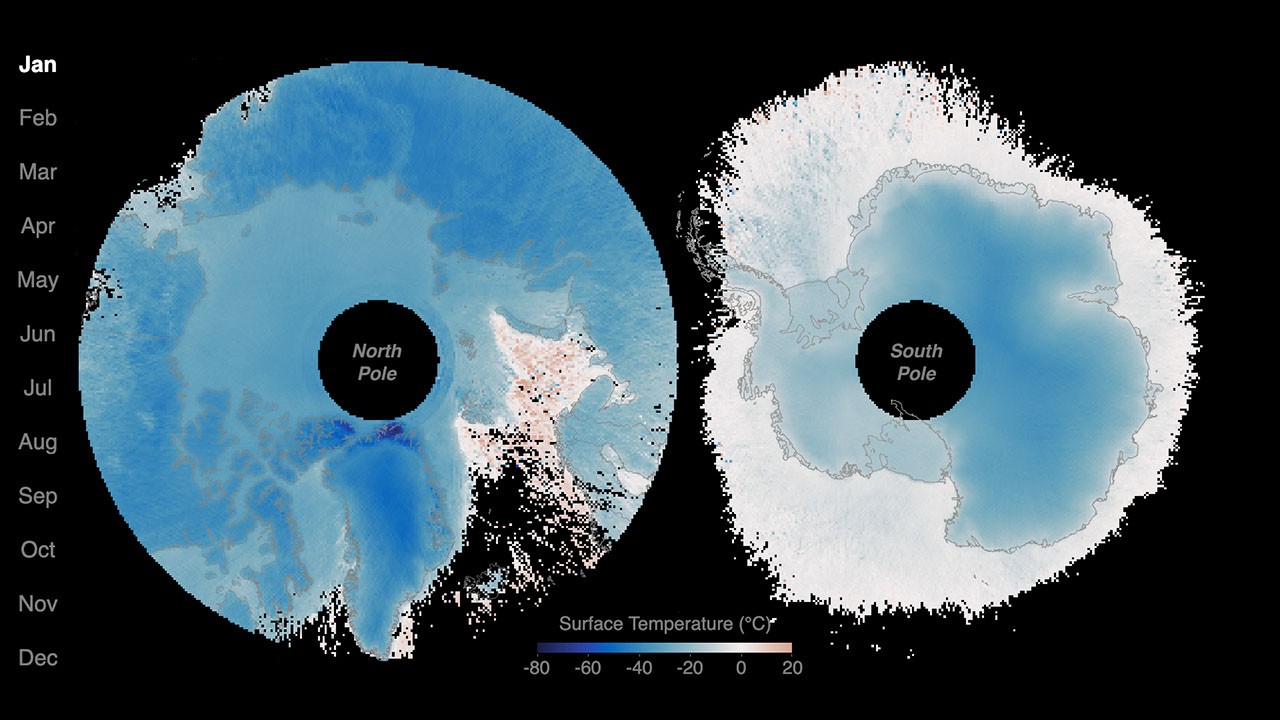
At the top and bottom of the planet, the seasons arrive on a schedule all their own. Satellite data from a mission measuring infrared energy reveal just how differently—and how dramatically—surface temperatures swing across two full years at the poles.
In this animation, surface temperatures across the Arctic and Antarctic pulse between cold (dark blue) and milder to warm (lighter blue to red). Data for the animation come from NASA’s PREFIRE (Polar Radiant Energy in the Far-InfraRed Experiment) satellites. The mission’s twin CubeSats began collecting science data in July 2024 and have now captured two complete seasonal cycles at each pole.
Because the two poles sit in opposite hemispheres, their seasons occur at opposite times—and the swing between seasons differs, too. In the Arctic, cold, dark winters give way to summers warm enough to thaw vast stretches of tundra and sea ice. In Antarctica, Earth’s coldest continent, summer temperatures rarely climb above freezing before the bitter cold of winter returns.
Surface temperatures, and how they fluctuate, offer a window into Earth’s energy budget, the net flow of energy into and out of the Earth system. Sunlight absorbed by the surface is re-radiated as infrared heat, which bounces between Earth’s surface and atmosphere before escaping to space. The poles play an important role in this process. Atmospheric and ocean circulation carries excess heat absorbed in the tropics toward the poles, where it radiates away to space, helping regulate the planet’s temperature.
“By measuring invisible heat radiating from Earth’s coldest places, PREFIRE is helping scientists understand why the poles are changing so rapidly, and what those changes might mean for the rest of the planet,” said Chad Greene, a glaciologist at NASA’s Jet Propulsion Laboratory.
Scientists have long known that far-infrared radiation accounts for nearly 60 percent of the energy Earth loses to space, but that portion of the spectrum—invisible to human eyes—had never been comprehensively measured on a global scale. By directly tracking this invisible energy in near-real-time, the PREFIRE mission is helping scientists refine models and gain a better understanding of the Earth system.
“Weather systems, river flows, shipping routes, and ice sheet stability are all influenced by energy movement in a part of the spectrum that only PREFIRE can see,” said Tristan L’Ecuyer, an atmospheric scientist at the University of Wisconsin-Madison and principal investigator of the PREFIRE mission. “Now that the invisible has been made visible, we can begin to improve weather and climate predictions that industries, our national defense, and Arctic communities rely on.”
Maps courtesy of Chad Greene, NASA/JPL, using data from NASA’s PREFIRE mission. Story by Kathryn Hansen.